
Web-based Interactive and Visual Data Analysis for Ubiquitous Learning Analytics
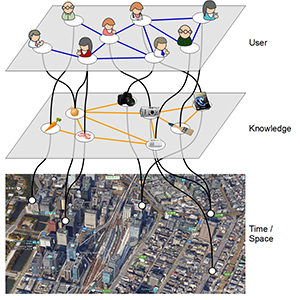
Interactive visual data analysis is a well-established class of methods to gather knowledge from raw and complex data. A broad variety of examples can be found in literature presenting its applicability in various ways and different scientific domains. However, fully fledged solutions for visual analysis addressing learning analytics are still rare. Therefore, this paper will discuss visual and interactive data analysis for learning analytics by presenting best practices followed by a discussion of a general architecture combining interactive visualization employing the Information Seeking Mantra in conjunction with the paradigm of coordinated multiple views. Finally, by presenting a use case for ubiquitous learning analytics its applicability will be demonstrated with the focus on temporal and spatial relation of learning data. The data is gathered from a ubiquitous learning scenario offering information for students to identify learning partners and provides information to teachers enabling the adaption of their learning material.
@InProceedings{weyers2016a,
Title = {Web-based Interactive and Visual Data Analysis for Ubiquitous Learning Analytics},
Author = {Benjamin Weyers, Christian Nowke, Torsten Wolfgang Kuhlen, Mouri Kousuke, Hiroaki Ogata},
Booktitle = {First International Workshop on Learning Analytics Across Physical and Digital Spaces co-located with 6th International Conference on Learning Analytics \& Knowledge (LAK 2016)},
Year = {2016},
Pages = {65--69},
Editor = {Roberto Martinez-Maldonado, Davinia Hernandez-Leo},
Volume = {1601},
Abstract = {Interactive visual data analysis is a well-established class of methods to gather knowledge from raw and complex data. A broad variety of examples can be found in literature presenting its applicability in various ways and different scientific domains. However, fully fledged solutions for visual analysis addressing learning analytics are still rare. Therefore, this paper will discuss visual and interactive data analysis for learning analytics by presenting best practices followed by a discussion of a general architecture combining interactive visualization employing the Information Seeking Mantra in conjunction with the paradigm of coordinated multiple views. Finally, by presenting a use case for ubiquitous learning analytics its applicability will be demonstrated with the focus on temporal and spatial relation of learning data. The data is gathered from a ubiquitous learning scenario offering information
for students to identify learning partners and provides information to teachers enabling the adaption of their learning material.},
Keywords = {interactive analysis, web-based visualization, learning analytics},
Url = {http://ceur-ws.org/Vol-1601/}
}
